Question 1.
This question asks you to manually perform K-means clustering manually, with $K=2$, on a small sample, $n=6$, and $p=2$ features.
| x_1 | x_2 | |
|---|---|---|
| Obs. | ||
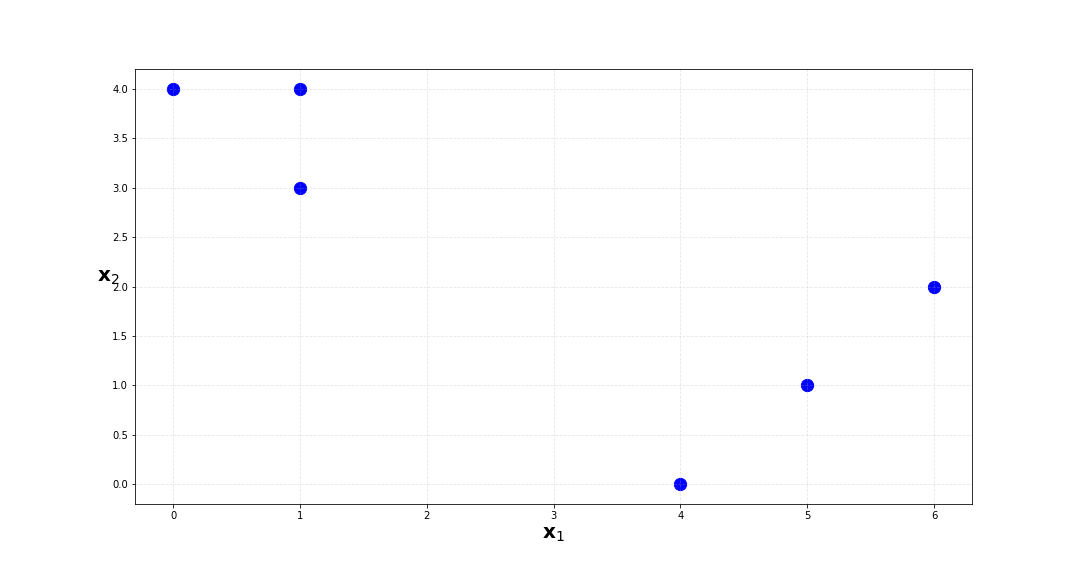
| 0 | 1 | 4 |
| 1 | 1 | 3 |
| 2 | 0 | 4 |
| 3 | 5 | 1 |
| 4 | 6 | 2 |
| 5 | 4 | 0 |
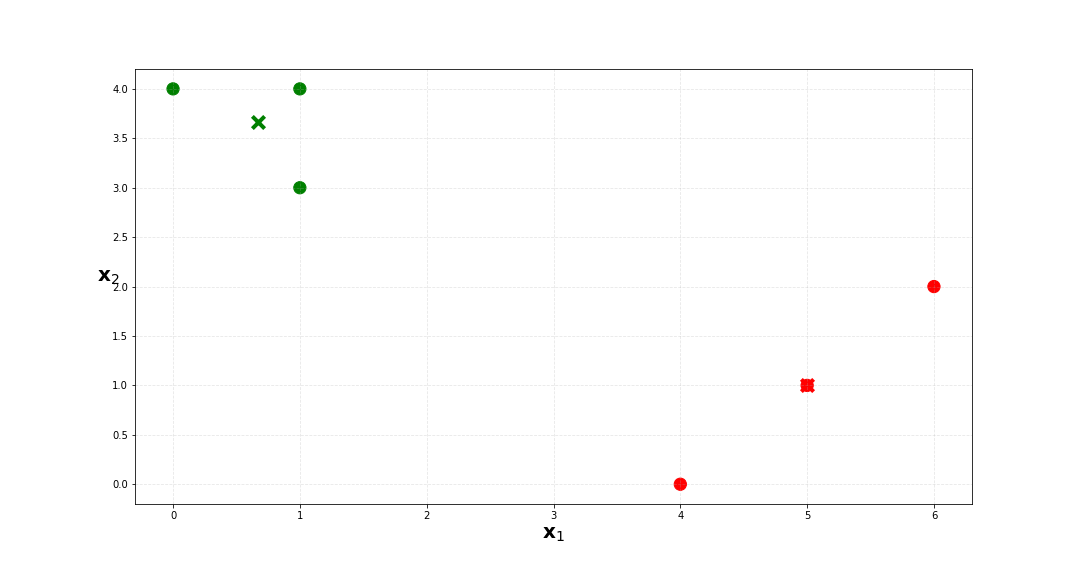
a. Plot the observations
Click here for answer
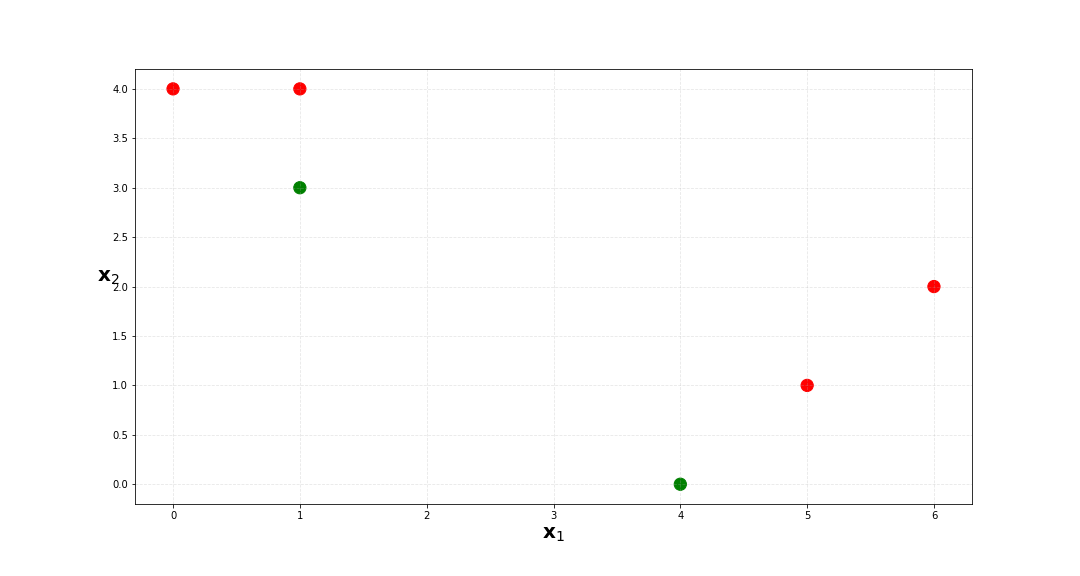
b. Randomly assign a cluster label to each observation. In Python you can use np.random.randint. Report the cluster labels for each observation.
Click here for answer
| x_1 | x_2 | labels | |
|---|---|---|---|
| Obs. | |||
| 0 | 1 | 4 | 0 |
| 1 | 1 | 3 | 1 |
| 2 | 0 | 4 | 0 |
| 3 | 5 | 1 | 0 |
| 4 | 6 | 2 | 0 |
| 5 | 4 | 0 | 1 |
np.random.seed(42))
c. Compute the centroid for each cluster.
Click here for answer
We can compute the centroid for the red cluster with $$ \begin{align} \bar x_{11} & = \frac{1}{4}(0+1+5+6) \\ & = 3 \\ \\ \bar x_{12} & = \frac{1}{4}(4+4+2+1) \\ & = 2.75 \\ \\ \end{align} $$ and the green cluster with $$ \begin{align} \bar x_{21} & = \frac{1}{2}(1+4) \\ & = 2.5 \\ \\ \bar x_{22} & = \frac{1}{2}(3+0) \\ & = 1.5 \\ \\ \end{align} $$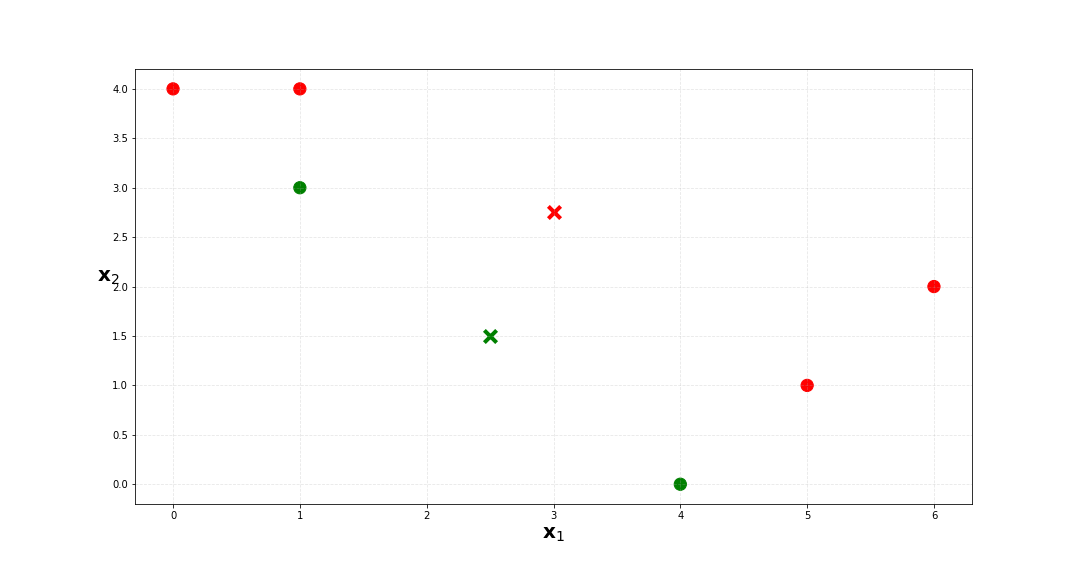
d. Assign each observation to the centroid to which it is closest, in terms of Euclidean distance. Report the cluster labels for each observation.
Click here for answer
| x_1 | x_2 | labels | |
|---|---|---|---|
| Obs. | |||
| 0 | 1 | 4 | 1 |
| 1 | 1 | 3 | 1 |
| 2 | 0 | 4 | 1 |
| 3 | 5 | 1 | 0 |
| 4 | 6 | 2 | 1 |
| 5 | 4 | 0 | 0 |
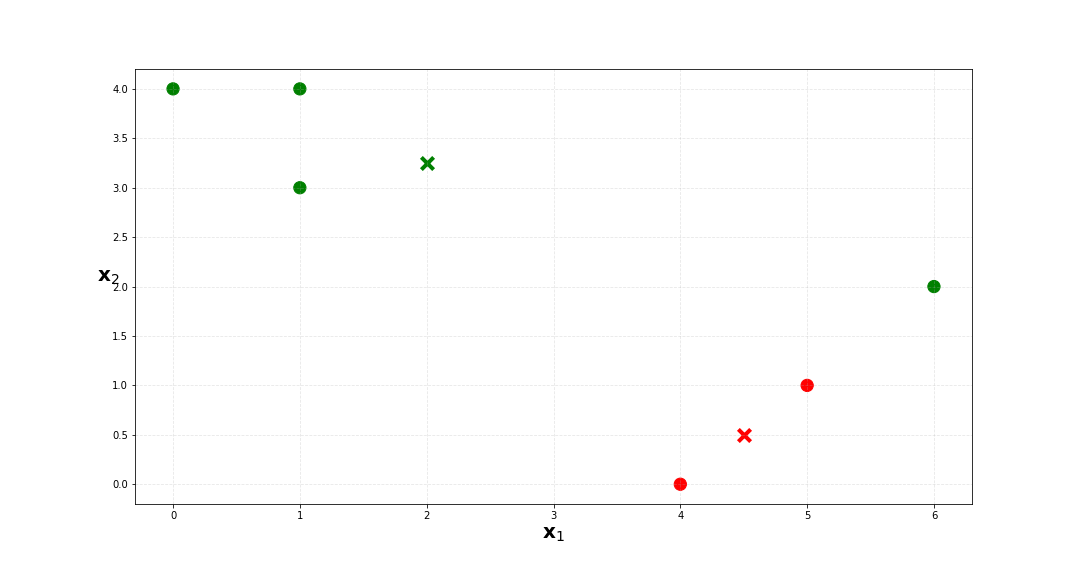
e. Find where the k-means cluster centers (e.g. where questions (c) and (d) stops changing), then color your plot according to these cluster labels.
Click here for answer
Question 2.
Describe two techniques to help select the number of clusters when using K-Means.
Click here for answer
1. The elbow rule is a simple techinique to select the number of clusters using k-means. Using the mean squared distance from each instance to its nearest centroid (inertia), and the number of clusters, we can plot a curve and find where the inetria stops dropping quickly (the "elbow"). 2. You could also plot a silhoutte scores as a function of the number of clusters. Silhouette coefficients vary from +1 for instances well within their clusters and far from oteher clusters, and -1 for instances close to anoter cluster.Question 3.
Suppose we have a dissimilarity matrix as follows:
$$\begin{bmatrix} & 0.3 & 0.4 & 0.7 \\ 0.3 & & 0.5 & 0.8 \\ 0.4 & 0.5 & & 0.45 \\ 0.7 & 0.8 & 0.45 & \\ \end{bmatrix}$$This means the dissimilarity between the first and second observation is 0.3, second and fourth is 0.8 ect.
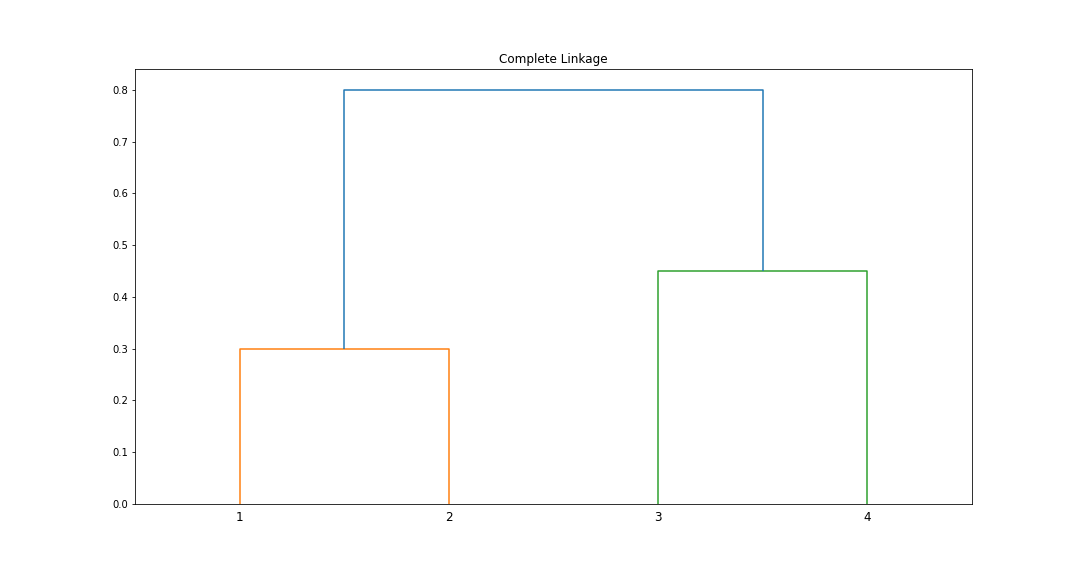
a. Sketch or code a diagram that results from hierarchically clustering these four observations using complete linkage.
Click here for answer
Beginning with $$\begin{bmatrix} & 0.3 & 0.4 & 0.7 \\ 0.3 & & 0.5 & 0.8 \\ 0.4 & 0.5 & & 0.45 \\ 0.7 & 0.8 & 0.45 & \\ \end{bmatrix}$$ we see that 0.3 is the minimum dissimilarity, so we fuse observations 1 and 2 to form the cluster (1,2) at height 0.3. This leaves our similarity matrix as: $$\begin{bmatrix} & 0.5 & 0.8 \\ 0.5 & & 0.45 \\ 0.8 & 0.45 & \\ \end{bmatrix}$$ because we are recording the _largest_ dissimilarities. For example, looking at the similarities between observations 1, 2, and 3, in our original matrix, we see that the dissimilarity between 1 and 3 is 0.4, and between 2 and 3 is 0.5. We pick 0.5 because it is the larger of the two, and this now represents the dissimilarity between our cluster (1,2) and 3. If you think in dataframes like me this may help to see this new matrix as:| (1,2) | 3 | 4 | |
|---|---|---|---|
| (1,2) | 0.00 | 0.50 | 0.80 |
| 3 | 0.50 | 0.00 | 0.45 |
| 4 | 0.80 | 0.45 | 0.00 |
b. Suppose we cut the dendogram from question (a) such that two there are two clusters, which observations are in which cluster?
Click here for answer
In this case, we have clusters (1,2) and (3,4).c. Sketch or code a diagram that results from hierarchically clustering these four observations using single linkage.
Click here for answer
Beginning with $$\begin{bmatrix} & 0.3 & 0.4 & 0.7 \\ 0.3 & & 0.5 & 0.8 \\ 0.4 & 0.5 & & 0.45 \\ 0.7 & 0.8 & 0.45 & \\ \end{bmatrix}$$ we see that 0.3 is the minimum dissimilarity, so we fuse observations 1 and 2 to form the cluster (1,2) at height 0.3. This leaves our similarity matrix as: $$\begin{bmatrix} & 0.4 & 0.7 \\ 0.4 & & 0.45 \\ 0.7 & 0.45 & \\ \end{bmatrix}$$ because we are recording the _smallest_ dissimilarities. We now see that the minimum dissimilarity is 0.4, so we fuse cluster (1,2) and observation 3 to form cluster ((1,2),3) at height 0.4. We now have the new dissimilarity matrix: $$\begin{bmatrix} & 0.45 \\ 0.45 & \\ \end{bmatrix}$$ It remains to fuse clusters ((1,2),3) and observation 4 to form cluster (((1,2),3),4) at height 0.45.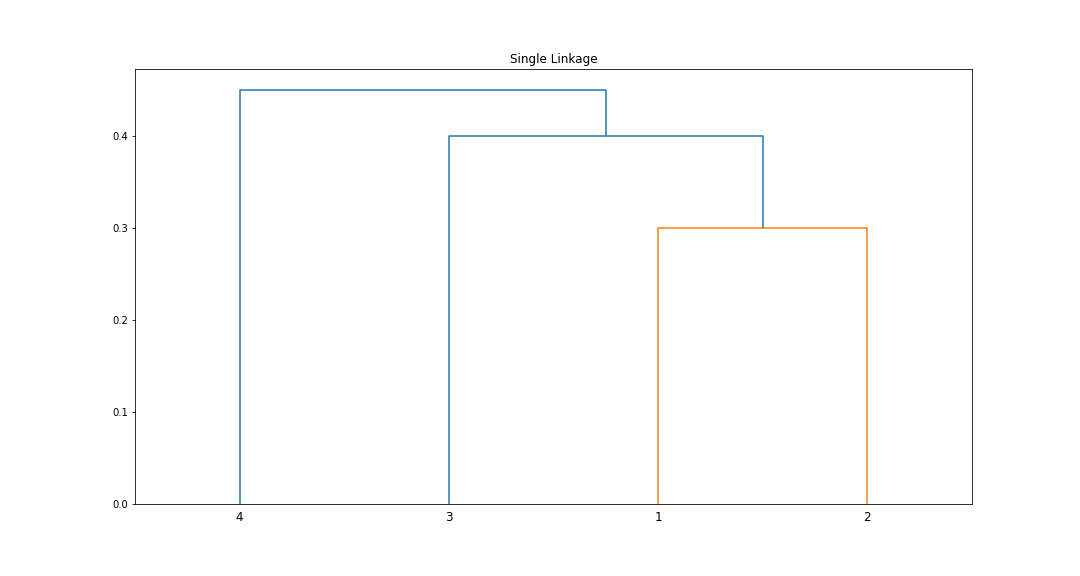
d. Suppose we cut the dendogram from question (c) such that two there are two clusters, which observations are in which cluster?